Metrics
This document outlines the key metrics for monitoring the performance and health of RollApps within the Dymension ecosystem. These metrics help identify issues related to block application, data availability (DA) layer connectivity, and submission processes.
Proper observability and alerting on these metrics ensure the smooth operation of RollApps and their integration with the Dymension L1.
Roller
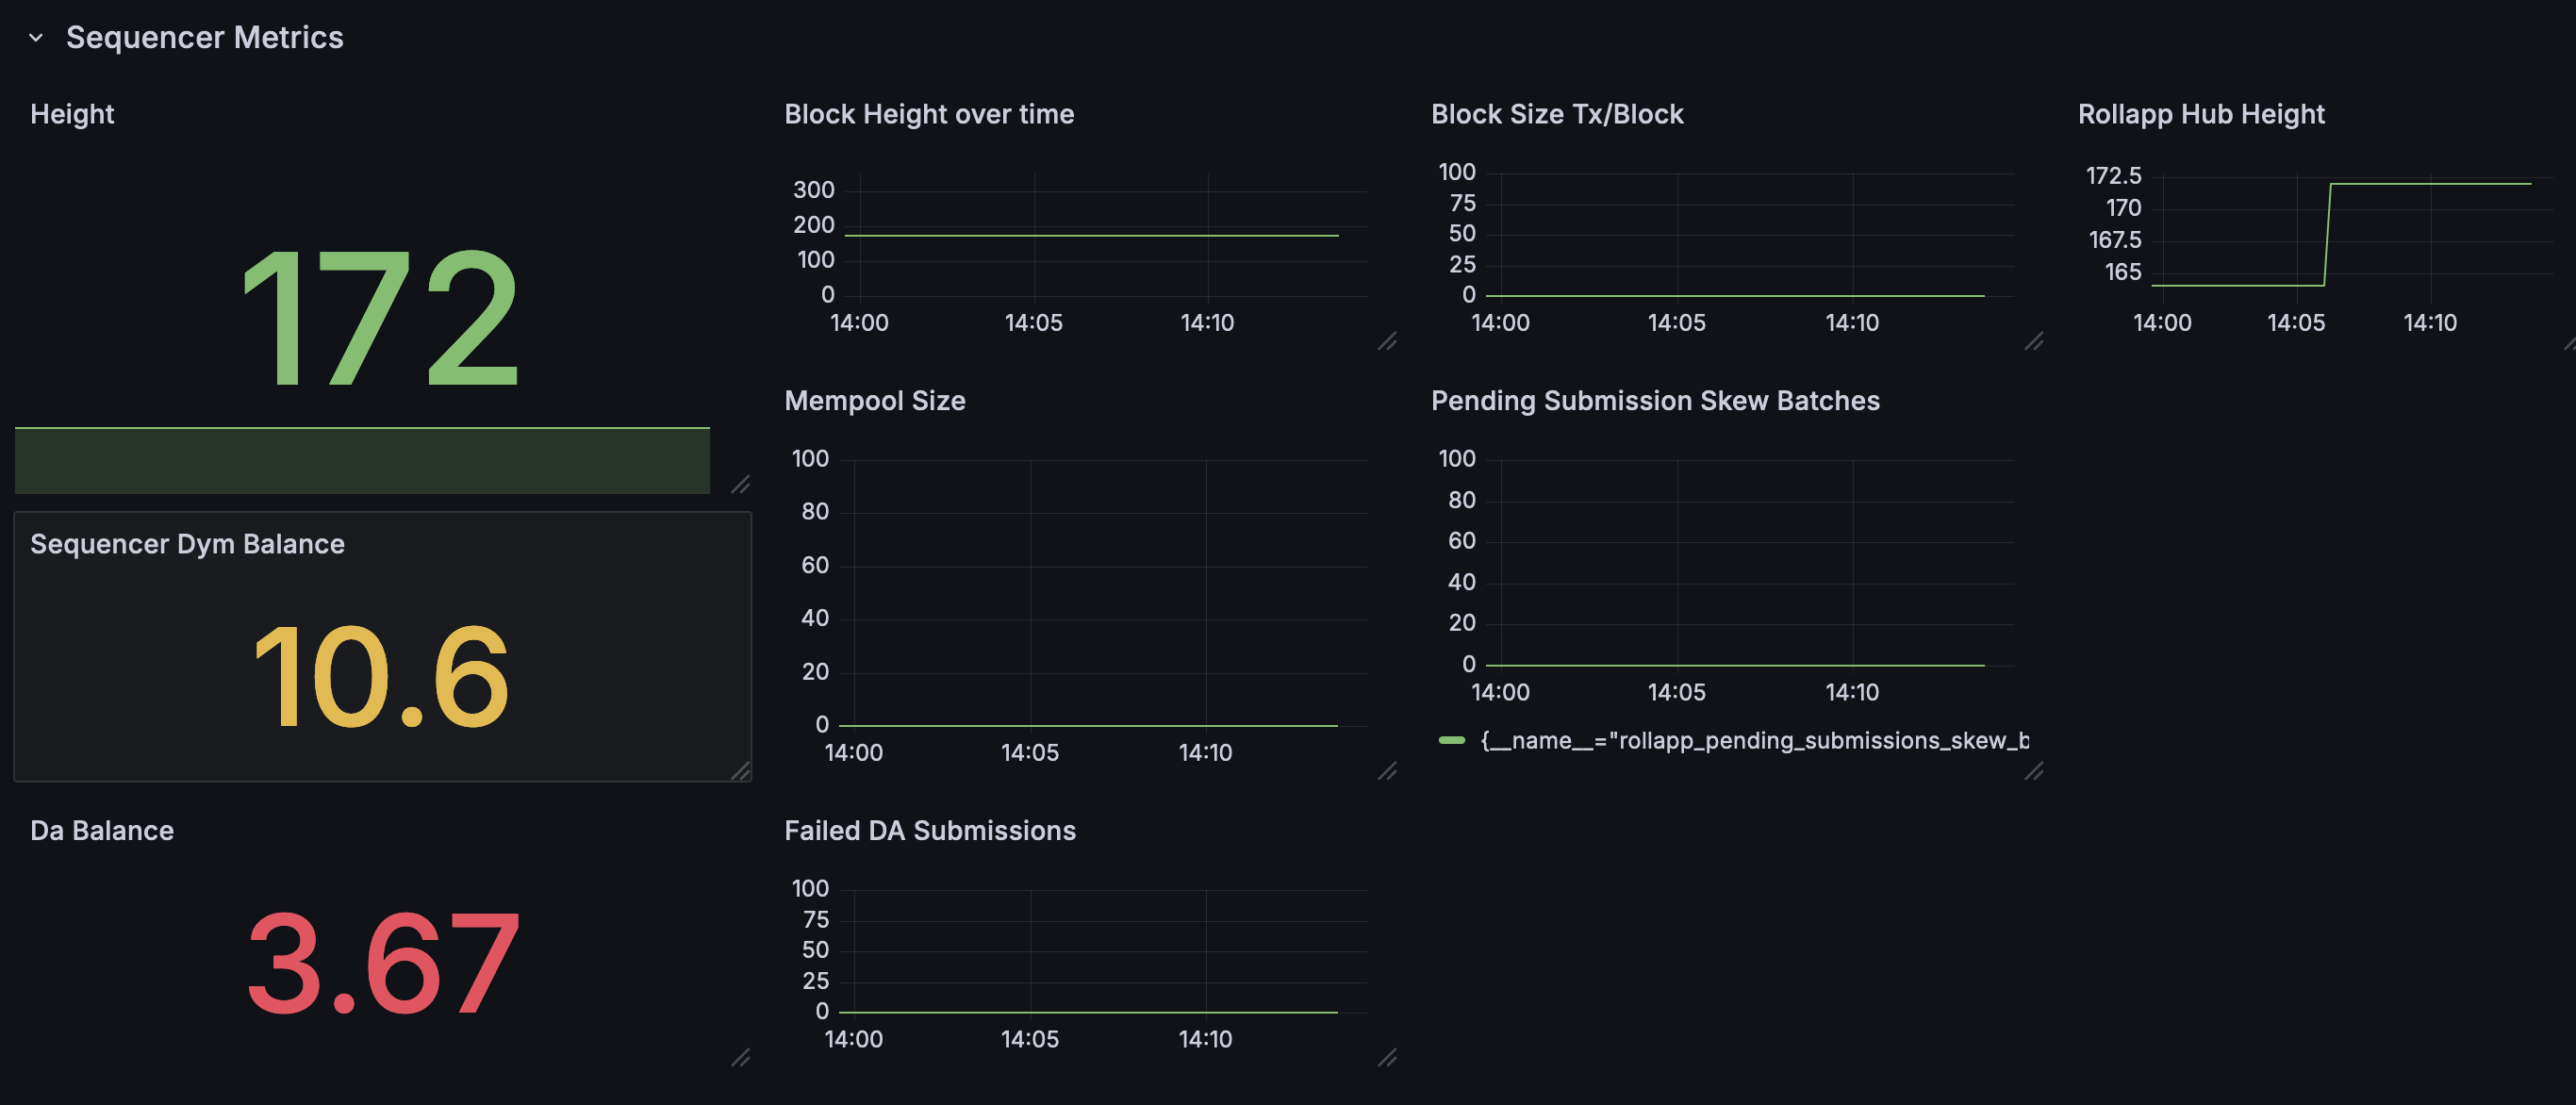
Roller provides a default observability dashboard that is wired with all of the core metrics that you can use out of the box.
The dashboard expects a prometheus data source that is fetching metrics from the default metric port of the rollapp’s node (2112)
If you have a custom setup but you would still like to use the dashboard provided by RollApp, you can always edit the dashboard to suit your needs.
Export RollApp observability metrics:
roller observability export
Output key metric values of the locally running RollApp:
roller observability query
To retrieve the current wallet balance and the overall RollApp status:
roller rollapp status

Grafana quickstart
Grafana quickstart requires Docker
docker-compose.yaml
version: '3'
services:
  prometheus:
    image: prom/prometheus
    volumes:
      - ./prometheus-config.yaml:/etc/prometheus/prometheus.yml
    ports:
      - 9092:9090
    extra_hosts:
      - "host.docker.internal:host-gateway"


  grafana:
    image: grafana/grafana
    ports:
      - 3002:3000
    volumes:
      - ./grafana/provisioning/datasources:/etc/grafana/provisioning/datasources
    environment:
      - GF_SECURITY_ADMIN_USER=admin
      - GF_SECURITY_ADMIN_PASSWORD=admin
prometheus-config.yaml
global:
  scrape_interval: 15s
  evaluation_interval: 15s

scrape_configs:
  - job_name: 'rollapp'
    static_configs:
      - targets: ['host.docker.internal:2112']
grafana/provisioning/datasources/prometheus.yaml
apiVersion: 1
datasources:
  - name: Prometheus
    type: prometheus
    access: proxy
    url: http://prometheus:9090
    isDefault: true
    version: 1
    editable: false
Key RollApp Metrics for Alerts
Below are the critical metrics to monitor, along with their significance and recommended alerting strategies:
dymint_mempool_size
- Description: This metric represents the number of transactions waiting to be included in a block within the RollApp's mempool.
- Significance: A continuous increase in
dymint_mempool_sizesuggests that transactions are not being processed efficiently, indicating potential issues with block application. - Alerting Strategy:
- Set alerts for sustained increases over a specific threshold (
50). - Investigate causes such as network congestion, validator performance issues, or configuration errors.
- Set alerts for sustained increases over a specific threshold (
rollapp_pending_submissions_skew_batches
- Description: This metric tracks the number of pending submission batches that have not yet been processed by the Dymension hub.
- Significance: An increasing number indicates potential bottlenecks or failures in submitting batches from RollApps to Dymension.
- Alerting Strategy:
- Monitor trends over time to detect unusual spikes.
- Trigger alerts if pending submissions exceed normal operating levels, prompting checks on submission processes and network connectivity.
rollapp_hub_height
- Description: Represents the height of successfully submitted and acknowledged blocks by the Dymension hub.
- Significance: If
rollapp_hub_heightdoes not increase over time, it may indicate submission issues between RollApps and the Dymension hub. - Alerting Strategy:
- Set alerts for stagnation in block height progression.
- Investigate potential causes such as network disruptions or protocol mismatches.
rollapp_consecutive_failed_da_submissions
- Description: Counts consecutive failures in submitting data to the DA layer.
- Significance: A rising count suggests problems with DA layer connectivity or instability in status nodes, potentially affecting data availability and integrity.
- Alerting Strategy:
- Alert when consecutive failures exceed a predefined threshold.
- Conduct root cause analysis focusing on network health, DA layer status, and node stability.
- Notes:
- roller has implemented so-called health-agent. This internal process checks for da node stability and this specific metrics and, if instability is encountered hotswaps the da node and restarts the light client process.
da_layer_balance
- Description: The balance of the da wallet the node uses for submitting data to the da layer
- Significance: The lack of sufficient balance on this wallet will cause eventual stop block production
- Alerting Strategy:
- Alert when the balance falls below a certain threshold (
5is a good default value ) - Top up the balance with enough tokens to continue sequencer operations
- Alert when the balance falls below a certain threshold (
hub_layer_balance
- Description: The balance of the dymension wallet the node uses for submitting data to the settlement ( dymension hub ) layer
- Significance: The lack of sufficient balance on this wallet will cause stop of block production
- Alerting Strategy:
- Alert when the balance falls below a certain threshold (
5is a good default value ) - Top up the balance with enough tokens to continue sequencer operations
- Alert when the balance falls below a certain threshold (